QGIS
How to Import CSV Coordinates into QGIS and Export GeoJSON
Learn to plot latitude and longitude from a CSV in QGIS, fix common coordinate errors, and export a GeoJSON file with a hands-on example.
By Spatialtuts Admin | | 3 min read
How to Import CSV Coordinates into QGIS and Export GeoJSON
Have a spreadsheet of latitude and longitude values but no map? In this tutorial, you'll turn a plain CSV into a point layer in QGIS, inspect the result, and export it as GeoJSON for use in other GIS tools and web maps. No programming or paid software is required.
You'll learn to: identify X and Y coordinate columns, load a CSV as point features, verify its coordinate reference system (CRS), and export the points as GeoJSON.
Before you begin
Software: QGIS 3.x (menu wording may vary slightly across versions).
Skills: opening a file and navigating the QGIS map canvas.
Time: approximately 10–15 minutes.
Data: five fictional sample locations near Islamabad, Pakistan, supplied below. These are practice coordinates, not verified businesses or real facilities.
Step 1: Download the data file islamabad_sample_points.csv
id,name,longitude,latitude,category
1,Sample Point A,73.0479,33.6844,Park
2,Sample Point B,73.0600,33.7000,School
3,Sample Point C,73.0850,33.7150,Clinic
4,Sample Point D,73.0300,33.6700,Library
5,Sample Point E,73.1000,33.6900,Market
Step 2: Import the CSV as a delimited text layer
Open QGIS and start a blank project.
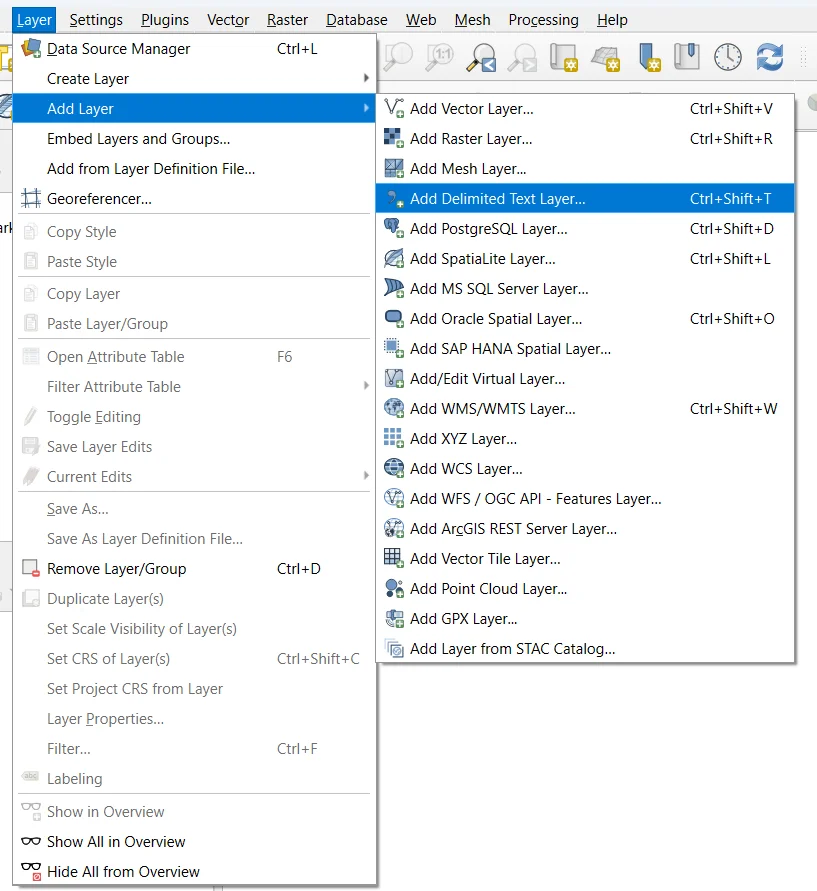
Choose Layer → Add Layer → Add Delimited Text Layer. You can also open Data Source Manager → Delimited Text
Under File name, browse to
islamabad_sample_points.csv.Under File format, select CSV (comma separated values), if it is not detected automatically.
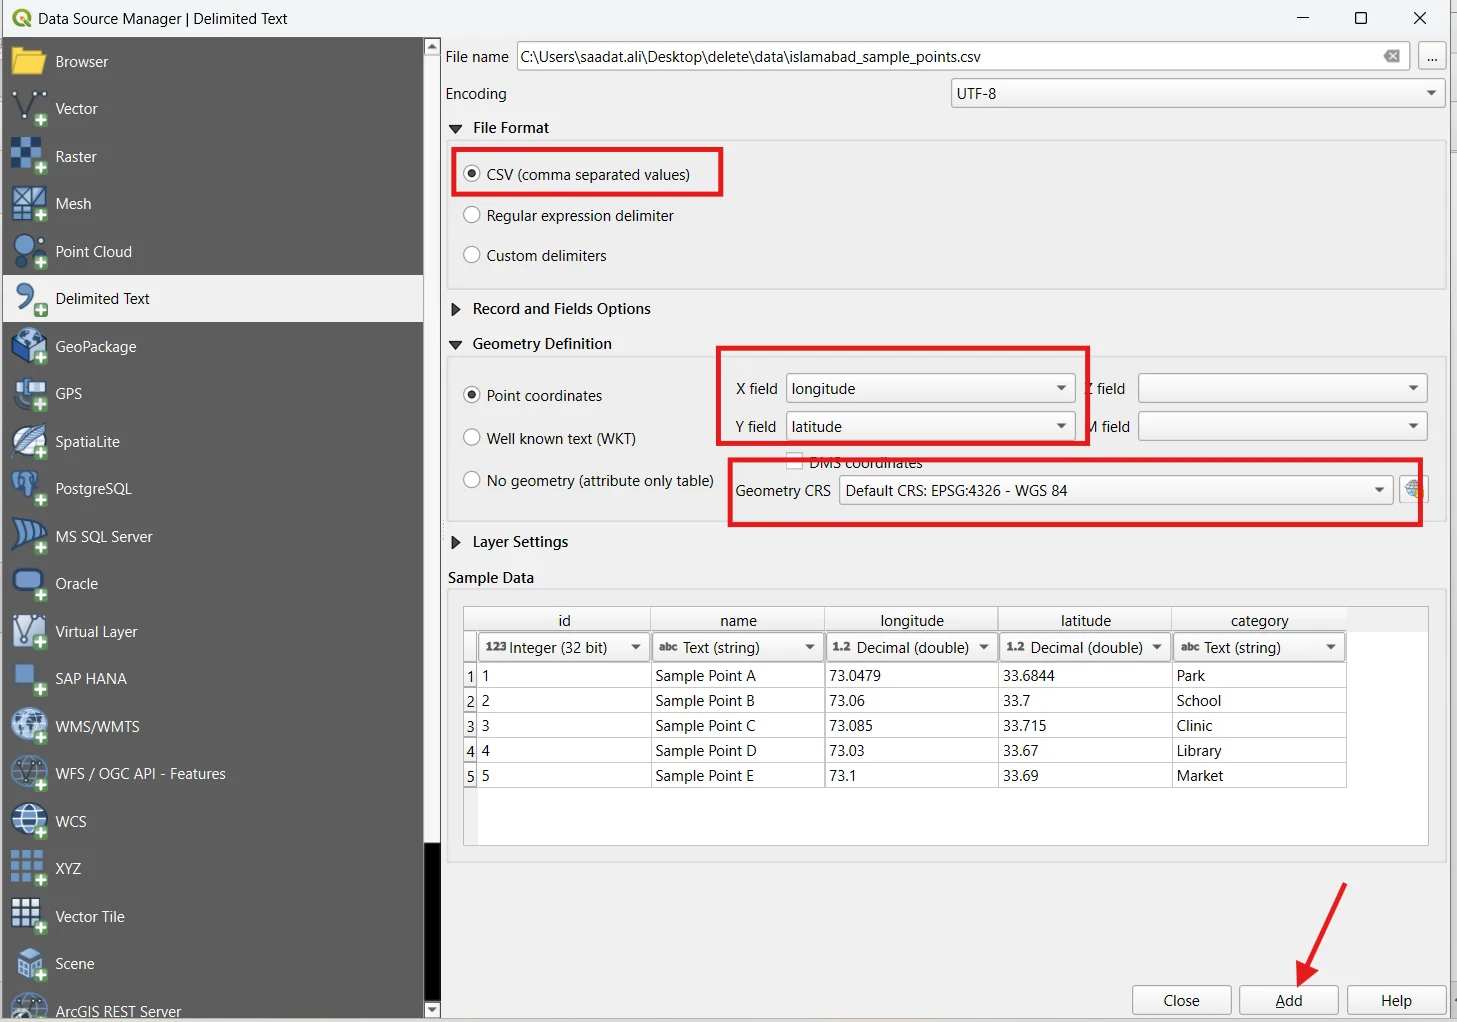
Under Geometry definition, select Point coordinates.
Set X field to
longitudeand Y field tolatitude.Set Geometry CRS to EPSG:4326 — WGS 84.
Click Add, then Close.
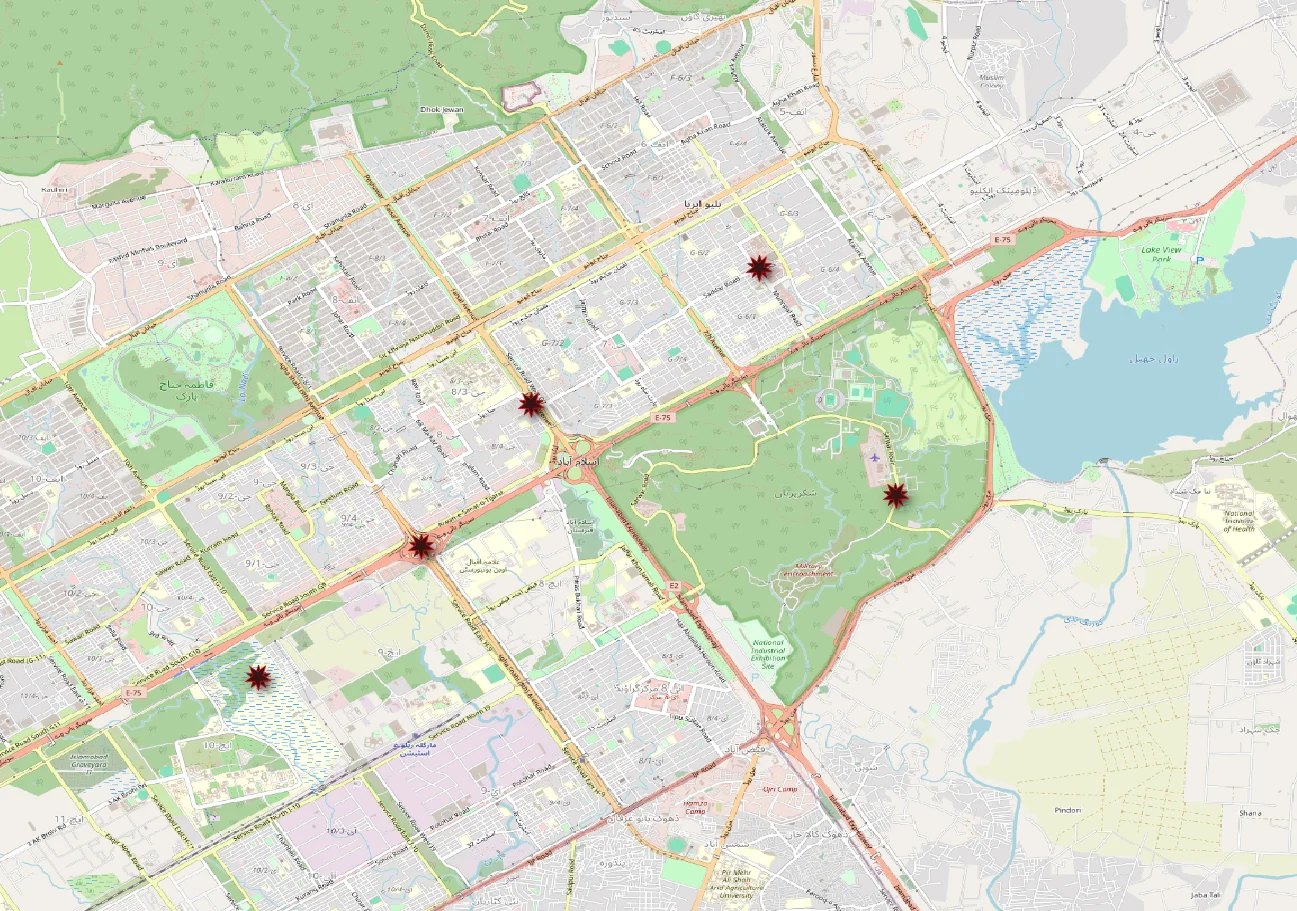
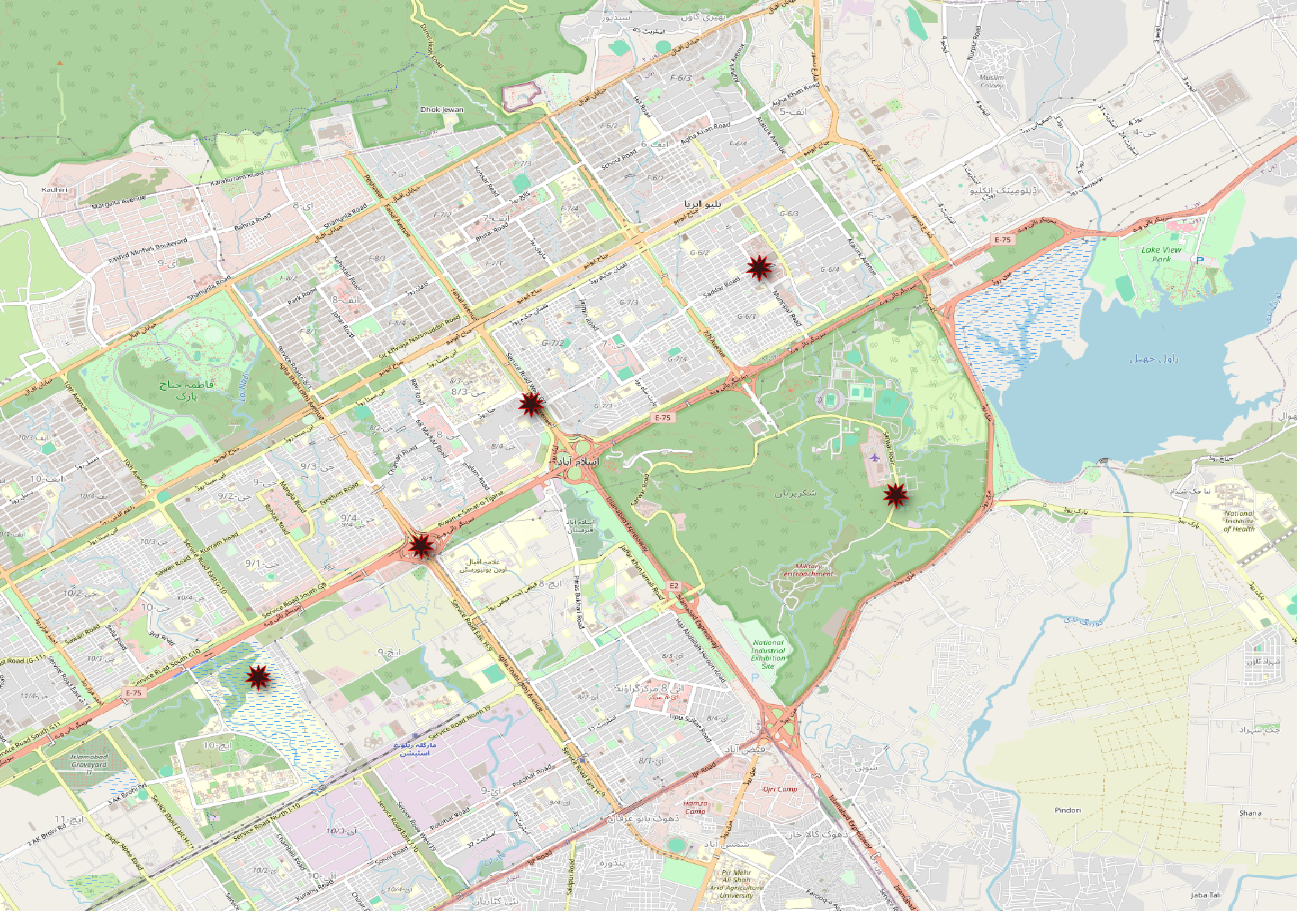
Checkpoint: A new layer appears in the Layers panel. Right-click it and choose Zoom to Layer. You should see five points in the Islamabad area.
Step 3: Inspect and style the imported points
Right-click the new layer and choose Open Attribute Table.
Confirm there are five features and that the
nameandcategoryvalues were imported correctly.Double-click the layer to open Layer Properties.
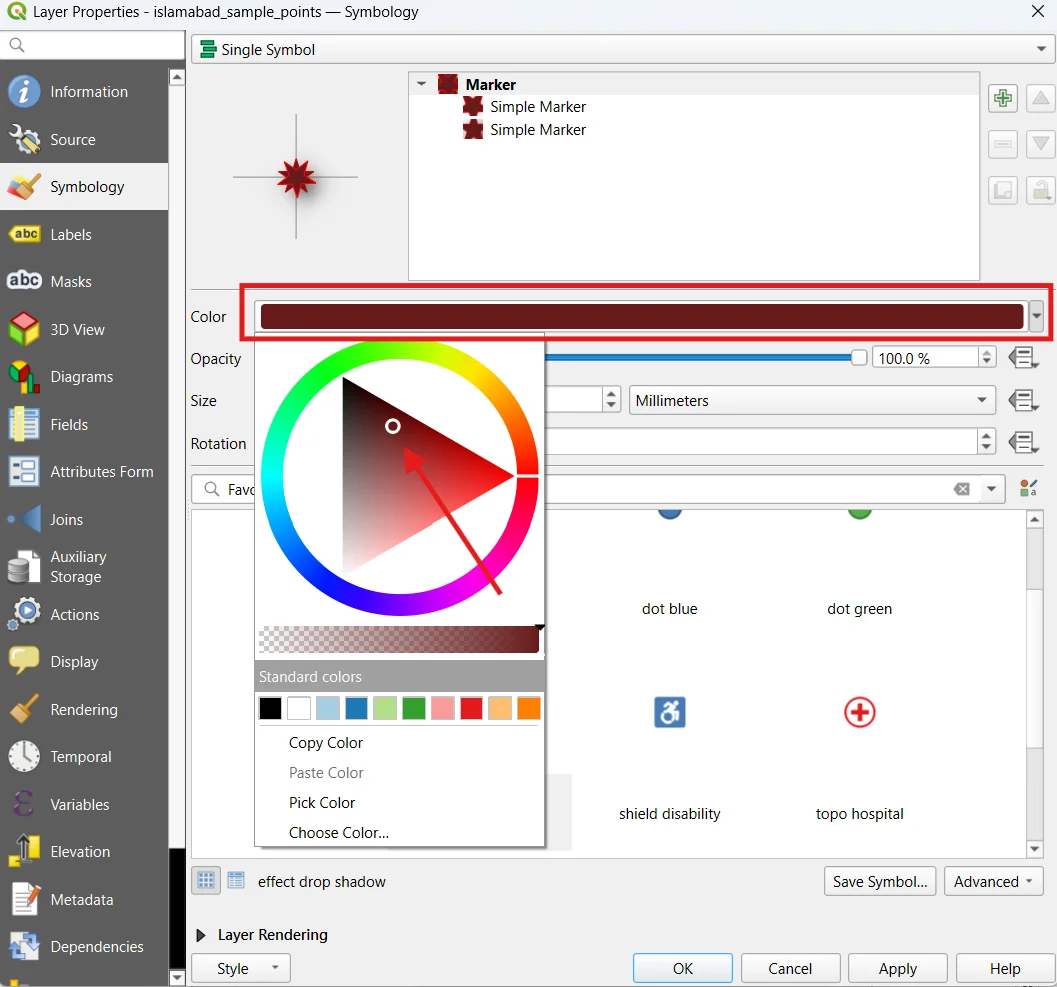
In Symbology, choose a clearly visible marker color and size.
Optional: in Labels, choose Single Labels and use the
namefield.Click Apply and OK.
Result would be displayed as:
Step 4: Export the points to GeoJSON
Right-click the point layer in the Layers panel.
Choose Export → Save Features As….
Set Format to GeoJSON.
Choose a filename such as
islamabad_sample_points.geojson.Set CRS to EPSG:4326 — WGS 84.
Check Add saved file to map if available.
Click OK.
GeoJSON stores the point geometry and attributes together. Its coordinate order for geographic positions is longitude, latitude—the reverse of the way people often say “latitude and longitude.”
Step 5: Verify the GeoJSON output
Open the exported .geojson in a text editor. The beginning should resemble this simplified example (QGIS may add other properties or formatting):
{
  "type": "FeatureCollection",
  "features": [
    {
      "type": "Feature",
      "properties": {"id": 1, "name": "Sample Point A", "category": "Park"},
      "geometry": {"type": "Point", "coordinates": [73.0479, 33.6844]}
    }
  ]
}
This example shows only one feature for readability; your exported file should contain five. In QGIS, right-click the exported layer → Open Attribute Table and verify the feature count.
0 comments
Sign in to join the discussion, or create an account.